2. Architecture#
The platform, as depicted in the picture above, is composed of different microservices that are orchestrated using state-of-the-art solutions such as Docker and Kubernetes.

2.1 Security#
The core of the security management is based on OIDC and OAUTH 2.0 standards. The solution supports Identity, Access and Organisation Management.
-
The Identity Management support enables it to manage single users (covering authentication aspects).
-
The Access Management supports the control of access of users to specific applications or platform services (e.g. dashboard) with a given role (e.g. editor), thus covering authorization and audit aspects.
-
The Organization Management support maps users to organizations (i.e. cities) so to host a multi-tenants within a single platform instance (i.e. different cities, same users) approach.
This solution, in combination with the support in the data management layer of data partitioning by tenant, enables the secure and controlled access by each tenant (e.g. a city) to its specific data. Moreover, it empowers different users to have access to different city data spaces with the same account.

The process works as follow:
-
When an API request is generated by a client
-
The token for the specific Application/Client is checked at Keycloak OAuth 2.0 API
-
If the token is valid (i.e. authenticated and authorized for a given OAuth client), the policy extracts from the token the list of tenants and verifies that the requested tenant space is included in the ones accessible.
In case of success, the call will be forwarded to the API in the backend (if not, the user will be returned a 401 “Not Authorized” response).
2.1.1 APIs#
2.1.2 Software used to realise this layer#
-
The open source solution adopted for the Identity and Access Management is Keycloak, the market-leading open source identity and access management solution developed by RedHat.
- Keycloak supports either MySQL or PostgreSQL as backends.
-
The adopted open source solution for API Management is gravitee.io. To apply access control to APIs, Gravitee offers a flexible plugin mechanism to implement access control policies.
- Gravitee requires MongoDB - for configuration - and ElasticSearch - for logs - as backends.
2.2 Data Management#
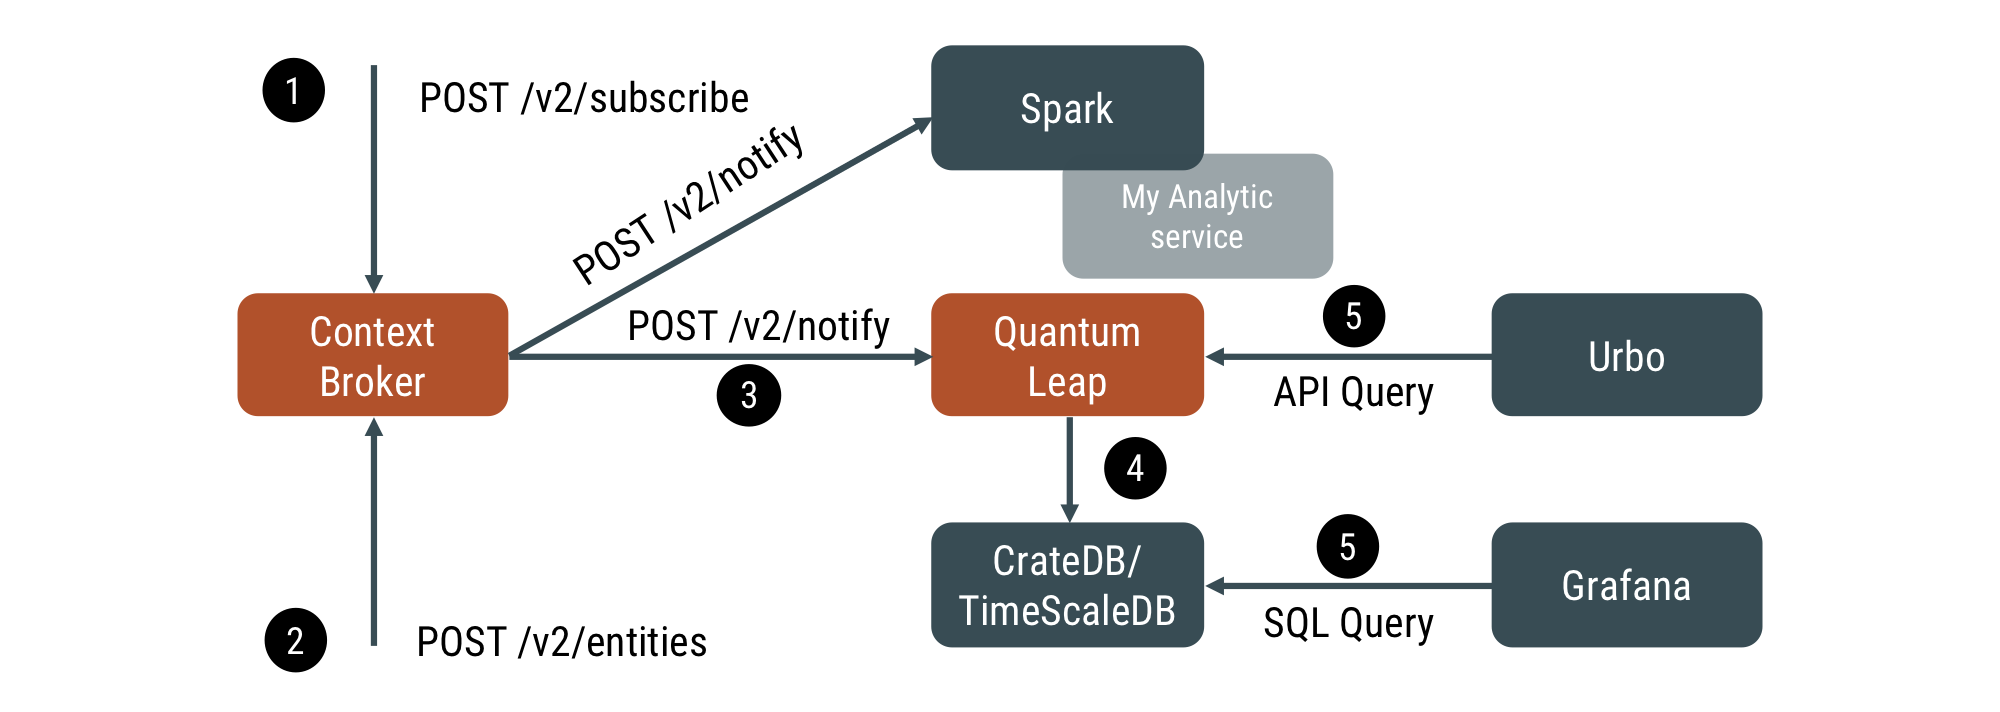
The core of the data management is a Context Broker API collecting data from the different sources and forwarding them to the different backend APIs based on the specific scenarios. All data used in the platform transits through it: IoT Devices data, External services data, Platform generated data.
Context Broker supports different interaction modes. Services can provide data to the Context Broker with the following modality:
-
Data Push: services send data to it.
-
Data Pull: services expose data via a standard API, that the Orion Context Broker queries to retrieve data.
-
Services can obtain data with the following modality:
-
Data Subscription: services subscribe to a given data and get notified when the data is updated.
-
Data Query: services query the Orion Context Broker to retrieve data.
-
These interaction modes provide a very flexible way to integrate data provider (e.g. sensors) and data processing services (e.g. analytics). In the case of IoT Agent, as discussed in the following section, the recommended solution is the Data Push model (however the Data Pull model is also supported), since this allows constantly up-to-date data in the Orion Context Broker that can be used to generate Data Subscriptions.
The other core component of the Data Management layer is the Timeseries API. The role of this component is to store all the historical data of a given entity (Context Broker stores only the current value in time of a data).

In short, the process will work as follows:
-
A subscription is created for each data model (e.g. Weather), to get notifications forwarded to the Timeseries API service (e.g. Quantum Leap)
-
Data of entities matching the created subscription gets updated in the Context Broker
-
Notifications are sent to the subscribed services (e.g. Quantum Leap). Each notification includes the whole data model (or a fragment, depending on the subscription created).
-
The subscribed service processes it using its logic (in the case of Quantum Leap, it stores the received data in CrateDB).
2.2.1 Software used to realise this layer#
-
The Context Broker API is provided by Orion, the reference implementation for a NGSIv2 Context Broker.
- Orion requires MongoDB as backend.
-
The Timeseries API is provided by Quantum Leap, an NGSIv2 compliant time series API. Quantum Leap supports as backend CrateDB, which is also supported by Grafana (see next section) to generate dashboards. QuantumLeap supports a variety of queries (including geographical-based), facilitating the access to historical data by services in need of working on batch data sets..
2.2.2 APIs#
2.3 Device Management#
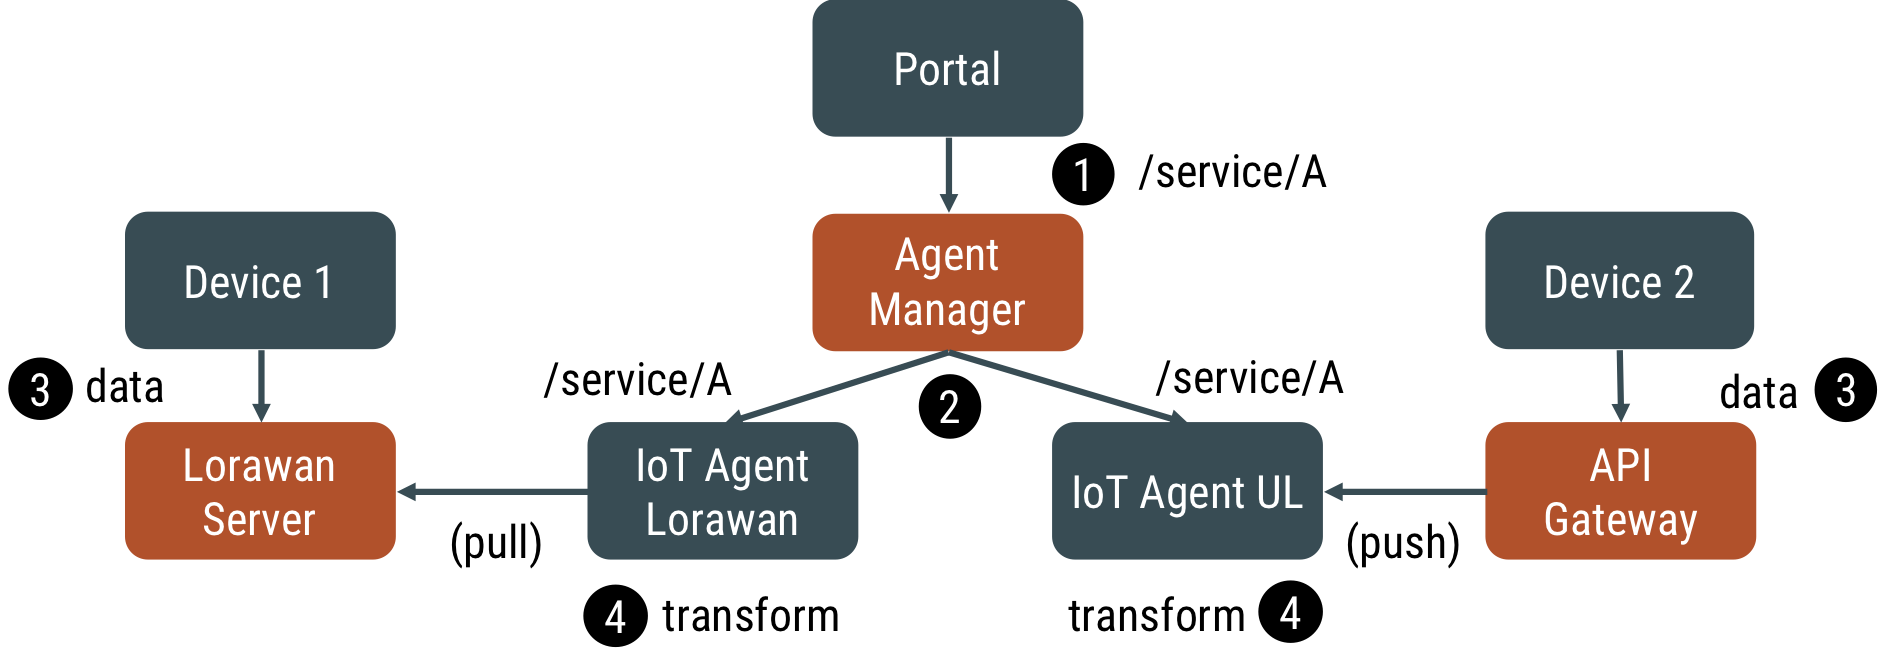
To manage the IoT devices, Orchestra Cities leverages FIWARE stack and
hence the NGSIv2 API and data format. FIWARE offers a wide range of
so-called IoT Agents. Each IoT Agent enables different transport and
message protocols to be used to connect IoT Devices. Orchestra Cities
covers all protocols supported by FIWARE (UL, JSON, LOWARAN), being the
recommended one UL, a very lightweight message protocol (e.g.
attribute1|value1|attribute2|value2 becomes t|10|s|true|l|78.8) that
supports MQTT, AMQP or HTTP transports. The IoT Agent role is to map low
level messages generated by the device to higher level information used
at the so-called application layer and to forward the structured and
aggregated information to the data management layer of the platform.
FIWARE IoT Agents support the concept of “device groups”, i.e. a set of
devices sharing the same information model. This facilitates the
registration of a large set of devices that provides the same
information, which would otherwise have required the user to configure
one-by-one with device-specific information (if required at all).

To facilitate the registration of IoT Devices within IoT Agents, we provide an UI, thus simplifying the overall operation. The process will work as follow:
-
Through the portal (or the API) a user can register a device
-
The device configuration (which includes for example the transport, besides the attribute mapping discussed above) is stored in the device registry for later use
-
Once configured, the device can send messages to the agent (in the picture, the HTTP transport is assumed)
-
When receiving a payload, the Agent checks the configuration of the device to transform the incoming “simple” message into the NGSIv2 payload
-
Finally, the Agent sends the NGSIv2 payload to the Context Broker
2.3.1 Software used to realise this layer#
-
IoT Agent Manager, an API proxy that allows to access different services implementing FIWARE IoT Agent configuration APIs.
- IoT Agent Manager requires MongoDB as backend.
-
IoT Agents, a set of services supporting integrate of sensors with Context Broker.
- IoT Agents requires MongoDB as backend.
2.3.2 APIs#
2.4 Dashboard Management#
Orchestra Cities allows creation of dashboards to monitor and visualise data. Dashboards include a set of “panels” that provides support for rendering objects such as lines, points, bars and heat graphs, basic maps with info pointers, picture panels and more useful panels to display any kind of data. Dashboards can show online historical data while filtering and sorting data dynamically. The data can be zoomed in to have fine-grained views of values or the same data can be seen in a Tabular format, allowing users to sort data by different column values. The ability to present maps with information points allows cities to visualize in real-time all the data that is being collected by the sensors. Besides that, cities are able to define actions based on the information and events of the dashboards and create alerts based on data thresholds; for example set an alert when a waste bin is on fire. Dashboards can be easily shared, customized and embedded in other tools.
Dashboards can run on multiple end-user devices without installation and provides good responsiveness for the dimensions of desktop screens, mobile phones and tablets.
2.4.1 Software used to realise this layer#
Dashboards can be realised with two solutions:
-
Grafana, an open platform for beautiful analytics and monitoring. Grafana includes a collection of data-source plugins, that allows it to integrate Grafana with different databases and backends such as Timescale and CrateDB (the back-ends of QuantumLeap), JSON, and Google calendar.
-
Urbo, an open source framework to develop elegant and interactive dashboards.
2.4.2 APIs#
2.5 Analytics#
While the dashboard can provide simple real-time analytics, for more complex tasks different solutions should be used. Depending on the use case, we recommend to leverage Apache Spark or other solutions. The different solutions, integrated to the Data Management layer, can analyse data sets (e.g. Weather forecast) whether they are real-time and/or historical data.
2.6 Data Integration#
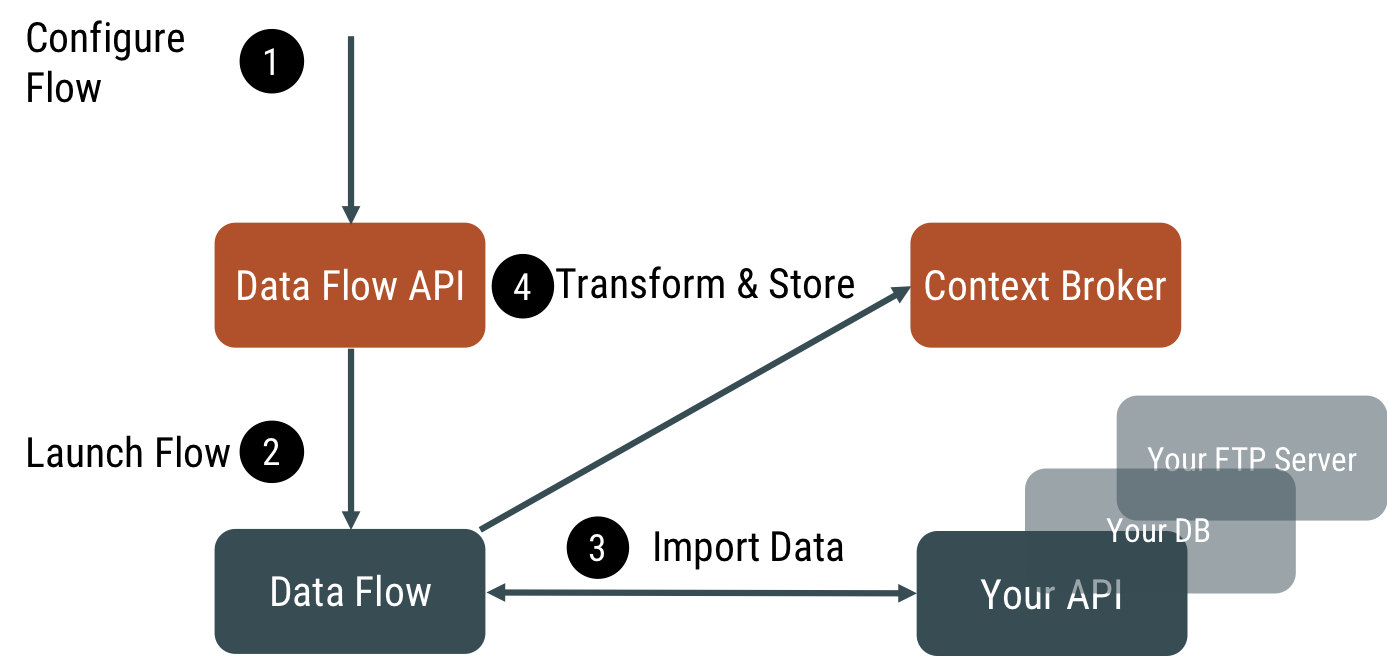
External data sources can be integrated via Context Broker API or QuantumLeap API (in this case, no real time data will be available for that data source).
This tool allows the creation of visual workflows for data injection into the platform. Workflows support web services, files and other sources and can be saved to replicable templates so that different cities can instantiate and customise their own data import flow for a given service.

2.6.1 Software used to realise this layer#
To integrate external services and data sources, Orchestra Cities currently leverages on Apache NIFI or Stream Sets Data Collector.
For better performances, it is also possible to develop python tasks. In this case, no visual support will be available to define the integration. Still you can leverage SDKs.